How a win gets a price
- $This season's salary for every rotation player we can match, from Basketball Reference's contract tables.
- WWins added: how much worse his team played without him last season, weighted by his minutes and turned into wins (2.7 a point of net rating).
- ÷The market rate is all the money divided by all the wins. Above it, a player is worth more than he costs.
Every rotation player, salary vs wins
Each dot is a player in his club's colour. The line is the market rate: above it the team is getting a discount, below it they pay a premium. Hover any dot for the numbers.
The bargains
Most value above pay, at the market rate.
- 1
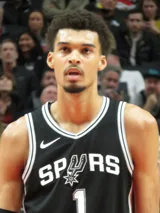 Victor WembanyamaSAS · $17M · +13.6 wins+57Mvalue over pay
- 2
 CJ McCollumATL · $21M · +12.7 wins+48Mvalue over pay
- 3
 Dyson DanielsATL · $25M · +13.0 wins+45Mvalue over pay
- 4
 Moussa DiabateCHA · $2.5M · +8.4 wins+43Mvalue over pay
- 5
 Julian ChampagnieSAS · $14M · +10.3 wins+42Mvalue over pay
- 6
 Donte DiVincenzoMIN · $13M · +10.0 wins+41Mvalue over pay
- 7Nique CliffordOKC · $3.3M · +8.2 wins+41Mvalue over pay
- 8
 Neemias QuetaBOS · $2.7M · +8.1 wins+41Mvalue over pay
- 9Ryan RollinsMIL · $4.0M · +7.8 wins+38Mvalue over pay
- 10
 Derrick WhiteBOS · $30M · +12.5 wins+37Mvalue over pay
The costliest wins
Most pay above what the minutes added last season.
- 1
 Jaylen BrownPHI · $57M · −4.9 wins−83Mpaid over value
- 2
 Brandon IngramLAC · $40M · −6.3 wins−74Mpaid over value
- 3
 Jaren Jackson Jr.UTA · $49M · −4.5 wins−73Mpaid over value
- 4
 Royce O'NealeCHA · $11M · −10.9 wins−70Mpaid over value
- 5
 Alperen SengunHOU · $36M · −5.5 wins−65Mpaid over value
- 6
 Zach LaVineSAC · $49M · −1.8 wins−59Mpaid over value
- 7
 Draymond GreenGSW · $28M · −5.2 wins−56Mpaid over value
- 8
 Bub CarringtonWAS · $4.9M · −9.2 wins−54Mpaid over value
- 9
 Andrew WigginsMIA · $30M · −4.2 wins−53Mpaid over value
- 10
 De'Andre HunterSAC · $25M · −5.0 wins−52Mpaid over value
Price per win, by team
What each team pays its core rotation for every win those players add. Shorter bar, better buying.
- 1
 Thunder$4.3M$188M · +44.2 W
- 2
 Spurs$4.3M$158M · +36.9 W
- 3
 Celtics$5.5M$126M · +22.9 W
- 4
 Hawks$5.5M$140M · +25.3 W
- 5
 Grizzlies$6.6M$74M · +11.1 W
- 6
 Nuggets$7.7M$203M · +26.2 W
- 7
 Raptors$7.8M$186M · +23.9 W
- 8
 Pistons$7.8M$150M · +19.2 W
- 9
 Timberwolves$9.7M$193M · +19.9 W
- 10
 Cavaliers$9.8M$195M · +19.8 W
- 11
 Nets$11M$113M · +10.0 W
- 12
 Heat$12M$180M · +15.6 W
- 13
 Trail Blazers$13M$141M · +10.7 W
- 14
 Suns$14M$133M · +9.7 W
- 15
 Rockets$14M$167M · +12.0 W
- 16
 76ers$14M$138M · +9.8 W
- 17
 Magic$16M$202M · +12.6 W
- 18
 Lakers$17M$148M · +8.5 W
- 19
 Warriors$70M$140M · +2.0 W
- 20
 Knicks$98M$202M · +2.1 W
- 21
 Pacers—$126M · −3.8 W
- 22
 Clippers—$97M · −4.1 W
- 23
 Hornets—$114M · −0.2 W
- 24
 Bulls—$123M · −12.1 W
- 25
 Mavericks—$110M · −8.8 W
- 26
 Wizards—$53M · −14.3 W
- 27
 Bucks—$113M · −5.7 W
- 28
 Pelicans—$144M · −0.4 W
- 29
 Kings—$174M · −4.8 W
- 30
 Jazz—$138M · −9.2 W
- $5.4M
An NBA win costs $5.4M in salary this season: the total paid to 146 rotation players divided by the wins their teams lose without them, in Hoops Nightly's model.
- +57M
Victor Wembanyama is the NBA's best bargain: +13.6 wins for $17M, about $57M of value above his pay at the market rate.
- $4.3M
The Oklahoma City Thunder pay the least per win among their core players ($4.3M), the Utah Jazz the most (—).
Source: Hoops Nightly, The Value Board (as of Tue, Nov 10): https://hoopsnightly.com/value-board (CC BY 4.0)More from our own data
- Milestone TrackerCareer marks about to fall, and the game they should fall in
- Defense vs PositionWhat every defense allows to guards, forwards and centers
- On/off calculatorAny team with or without any player, in net rating
- The Injury WaveRotation minutes lost to injury, day by day
- Day-to-day, measuredHow often a day-to-day player misses the next game
- The LedgerTrade and signing reports, checked against what happened
- The MarginRole changes and lineup anomalies the box score hides
- The Clutch MapWhere shots go, and who makes them, in the last five minutes of close games
- ComebacksThe biggest rallies, and how safe a lead really is
- The Real FiveThe best lineups with garbage time taken out
- The Report CardHow much warning every team gives before a player sits
- Lineup SurprisesExpected starters who didn't start, and every team's starting-five barcode
- Wins LostWhat absences have already cost every team
- The Second NightWhat really changes on the second night of a back-to-back
What to keep in mind
- Wins added come from on/off: how the team played with and without the player in 2025-26. On/off is noisy, so each figure is pulled toward zero by his minutes (x minutes / (minutes + 1000)). It measures the minutes, not the man.
- A player who changed teams carries last season's on/off from his old team. Rookies and players under 300 minutes last season are not on the board.
- Salaries are this season's cap figures from Basketball Reference; players we cannot match to a contract are left out.
- The market rate is ours, not the league's: total salary over total positive wins among the players on this board.