The four nights
Every regular-season game in 2025-26 and 2026-27, split by who had rest. Home court is in all four buckets.
↳Bottom lineA tired team beats a rested one 47.6% of the time; flip it, and the rested team wins 52.4%.
?How to read this chart
- The four cards
- every game sorted by rest: a tired team (second game in two nights) against a rested one, both tired, both rested, and a rested team against a tired one.
- The number and bar
- the win rate of the first team named. The white tick in the middle of the bar is 50%, a coin flip.
- Why two say 50%
- when both teams are in the same situation, one wins and one loses, so the rate is always exactly half.
- Tired vs rested47.6%332 games
- Both on a back-to-back50.0%160 games · always 50% by definition
- Both rested50.0%1880 games · always 50% by definition
- Rested vs tired52.4%332 games
The hangover, minute by minute
The average scoreboard for the tired team against a rested one, every minute of regulation, across 328 games we rebuilt from the play-by-play.
↳Bottom lineOn average the tired team is at its worst at minute 35, 2.0 points behind, and finishes −2.0.
?How to read this chart
- Left to right
- the 48 minutes of a regular game, split into four quarters.
- Up and down
- the tired team's average score margin at that minute. The bold zero line is a tied game; below it the tired team is behind.
- The two dots
- the lowest point of the curve and where it ends at the final buzzer. Hover or tap a minute for its exact value.
Quarter by quarter
Field-goal percentage by quarter, tired against rested, from 239,818 shots.
↳Bottom lineTired teams shoot −1.0 in the first quarter and −0.1 in the fourth, compared with rested opponents.
?How to read this chart
- Two bars per quarter
- gray is the rested team's field-goal percentage (share of shots made), purple the tired team's; purple turns red when the tired team shoots worse.
- The bars start at 40%
- so small gaps are visible; read the printed percentages, not the bar length alone.
- The big number
- the gap in percentage points, tired minus rested.
- Q147.4%46.4%−1.0rested · tired
- Q247.0%46.5%−0.6rested · tired
- Q347.6%48.0%+0.4rested · tired
- Q446.1%46.0%−0.1rested · tired
↳Bottom linePascal Siakam sat 7 of 12 second nights; Matas Buzelis loses the most shooting, −12.6 true shooting.
?How to read the two player lists
- Two thin bars
- under each name, purple is the second night of a back-to-back, gray is every other game.
- Who sits
- the big number is the share of second nights he missed; the gray bar is how often he misses other games.
- Shooters
- the big number is the change in true shooting (a shooting percentage that counts threes and free throws) on second nights, in percentage points.
Who sits the second night
Players averaging 20+ minutes who miss back-to-back second nights far more often than other games. At least 10 second nights each.
 Pascal SiakamIND · sat 7 of 12 second nights · 12.5% of other games58%
 Mark WilliamsPHX · sat 10 of 16 second nights · 17.2% of other games63%
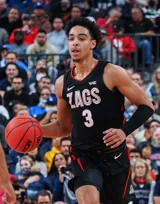 Andrew NembhardIND · sat 7 of 12 second nights · 17.7% of other games58%
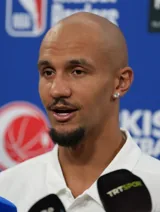 Jalen SuggsORL · sat 9 of 14 second nights · 23.9% of other games64%
 Darius GarlandCLE · sat 6 of 11 second nights · 14.9% of other games55%
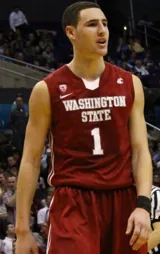 Klay ThompsonDAL · sat 7 of 15 second nights · 9.1% of other games47%
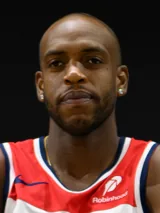 Khris MiddletonWAS · sat 7 of 14 second nights · 14.1% of other games50%
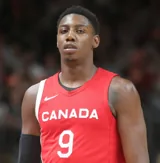 RJ BarrettTOR · sat 9 of 15 second nights · 24.2% of other games60%
 Daniel GaffordDAL · sat 7 of 13 second nights · 18.3% of other games54%
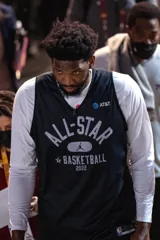 Joel EmbiidPHI · sat 12 of 15 second nights · 46.0% of other games80%
Shooters who fade
True shooting on second nights against all other games. At least 10 second nights and 120 shots in them.
 Matas BuzelisCHI · 48.2% TS on 15 second nights · 60.8% otherwise−12.6
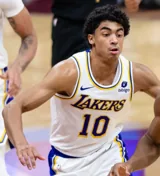 Max ChristieDAL · 50.0% TS on 15 second nights · 60.6% otherwise−10.6
 Jaylen WellsMEM · 48.8% TS on 11 second nights · 58.3% otherwise−9.5
 Jarace WalkerIND · 46.8% TS on 15 second nights · 55.6% otherwise−8.8
 Jaylen BrownPHI · 49.6% TS on 12 second nights · 58.3% otherwise−8.7
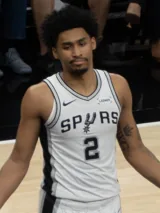 Dylan HarperSAS · 51.5% TS on 17 second nights · 60.0% otherwise−8.4
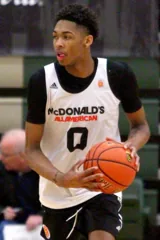 Brandon IngramTOR · 51.5% TS on 13 second nights · 58.7% otherwise−7.2
 Derrick WhiteBOS · 47.6% TS on 14 second nights · 54.2% otherwise−6.6
…and the ones who don't
 Daniss JenkinsDET · 67.5% TS on 15 second nights · 50.2% otherwise+17.4
 Bub CarringtonWAS · 64.9% TS on 18 second nights · 52.9% otherwise+12.0
 Kyle FilipowskiUTA · 66.2% TS on 16 second nights · 56.2% otherwise+10.0
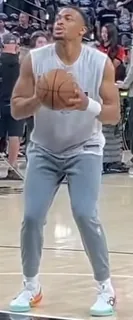 Keldon JohnsonSAS · 67.3% TS on 18 second nights · 58.3% otherwise+9.1
- Ace BaileyUTA · 60.4% TS on 14 second nights · 51.4% otherwise+9.0
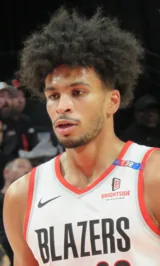 Toumani CamaraPOR · 65.8% TS on 16 second nights · 57.0% otherwise+8.8
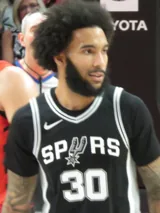 Julian ChampagnieSAS · 67.5% TS on 18 second nights · 59.7% otherwise+7.8
 Jared McCainOKC · 59.8% TS on 15 second nights · 52.1% otherwise+7.8
Every team on no rest
Record on the second night of a back-to-back against the record with rest, 2025-26 and 2026-27.
↳Bottom lineThe Pistons handle it best (14-2 on second nights); the Nets worst (1-16).
?How to read this chart
- The colored bar
- the team's win rate on second nights.
- The white tick
- its win rate with rest. A bar that stops short of the tick means the team drops off when tired.
- Record and gap
- second-night wins-losses, then the gap between the two rates in percentage points.
 Pistons14-2+17.2
 Spurs15-3+8.0
 76ers13-5+19.4
 Lakers12-5+3.9
 Heat13-6+20.5
 Hornets12-6+20.1
 Nuggets11-6−2.0
 Trail Blazers10-6+11.8
 Knicks9-6−4.9
 Magic9-6+10.0
 Celtics9-6−13.3
 Rockets9-7−10.4
 Thunder9-7−25.7
 Jazz8-8+31.1
 Cavaliers8-8−15.3
 Hawks8-8−7.9
 Timberwolves8-8−12.7
 Suns8-9−7.1
 Warriors8-10−4.2
 Bucks7-9+10.0
 Raptors6-10−20.6
 Mavericks6-11−1.2
 Kings4-10+3.6
 Pelicans5-13−6.5
 Grizzlies4-11−8.0
 Clippers4-12−28.4
 Pacers3-12−3.7
 Bulls3-12−17.8
 Wizards2-16−13.5
 Nets1-16−22.9
Second-night win rate Win rate with rest
- 47.6%
NBA teams on the second night of a back-to-back won 47.6% of 332 games against rested opponents in 2025-26 and 2026-27, per Hoops Nightly.
- −1.0 pts
The back-to-back hangover shows up early: tired NBA teams shoot 1.0 points worse from the field in the first quarter, and 0.1 points worse in the fourth.
- -2.0
On the second night of a back-to-back against a rested team, the tired team trails by 2.0 points on average at its low point, minute 35, across 328 games tracked minute by minute.
Source: Hoops Nightly, The Second Night (as of Mon, Nov 9): https://hoopsnightly.com/second-night (CC BY 4.0)More from our own data
- Milestone TrackerCareer marks about to fall, and the game they should fall in
- Defense vs PositionWhat every defense allows to guards, forwards and centers
- On/off calculatorAny team with or without any player, in net rating
- The Injury WaveRotation minutes lost to injury, day by day
- Day-to-day, measuredHow often a day-to-day player misses the next game
- The LedgerTrade and signing reports, checked against what happened
- The MarginRole changes and lineup anomalies the box score hides
- The Clutch MapWhere shots go, and who makes them, in the last five minutes of close games
- ComebacksThe biggest rallies, and how safe a lead really is
- The Real FiveThe best lineups with garbage time taken out
- The Report CardHow much warning every team gives before a player sits
- Lineup SurprisesExpected starters who didn't start, and every team's starting-five barcode
- The Value BoardWhat every player costs per win
- Wins LostWhat absences have already cost every team
What to keep in mind
- A back-to-back is a game with zero full days of rest before it, counted from the schedule. The first game of a season has no rest figure and is left out.
- Teams on a back-to-back are on the road more often, so part of the gap is travel and home court, not only fatigue.
- The minute-by-minute curve uses the games we have rebuilt from the play-by-play, which can be fewer than the season total while the archive fills in.
- Players who sit on second nights may be resting by plan or nursing an injury; the box score does not say which.